playdate.graphics.setStencilPattern(pattern) appears to allocate memory on every invocation, even if pattern is a precomputed pattern table or just a threshold level.
Discord user `scizzorz` reported this behavior and provided this minimal example:
import "CoreLibs/graphics"

local gfx <const> = playdate.graphics

function playdate.update()
  for i = 1, 200 do
    gfx.setStencilPattern(0.5)
  end
end
I ran into and confirmed the same behavior, with similar napkin math of about 80bytes per call.
I also observed a non-trivial amount of CPU overhead, when compared to using `setDitherPattern`.
A straw-man theory here is that a pattern table/array/representation is being dynamically generated by the SDK, which would show up in both mem and cpu (could be wrong, just offering a mental model).
A short term suggestion would be to add a warning to setStencilPattern in the docs that warns that it is not suitable to be used inside the update loop, similar to the warning for Image Transformations. Long term a fix would be great, but a mention about perf in the docs would be helpful.
It’s easy to frequently intersperse other draw modifiers (setColor, setDitherPattern, setLineWidth, etc etc) without issue, and casually reach for `setStencilPattern` only to stumble into perf problems.
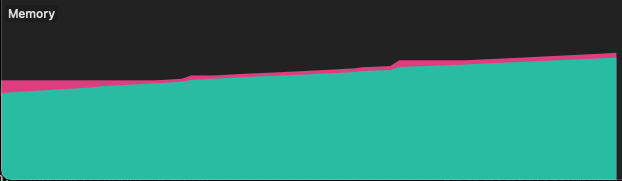
Screengrab of memory with & without calls to `setStencilPattern`: